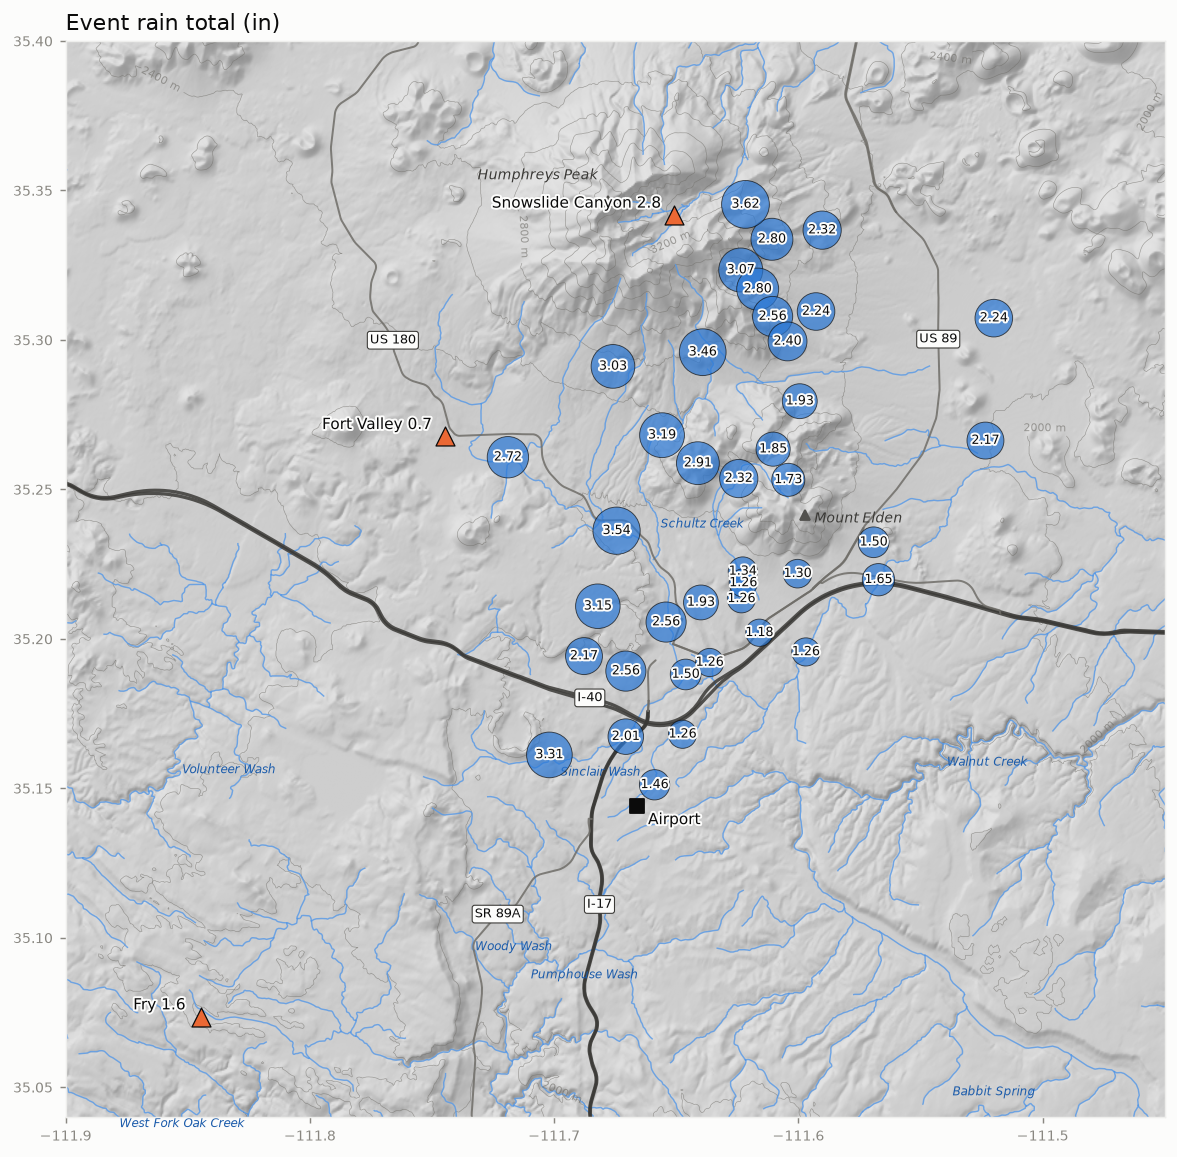
October 18–22, 2026
Provisional
Network median 2.24 in (range 1.18–3.62 in)
Summary
Across 39 gauges the event total ranged from 1.18 to 3.62 in (median 2.24 in). The central 80% of the network-mean rain fell between Oct 21 05:00 MST and Oct 22 10:00 MST (29 h). ERA5 does not yet cover this event, so the atmospheric setting is not yet described.
Rain across the network
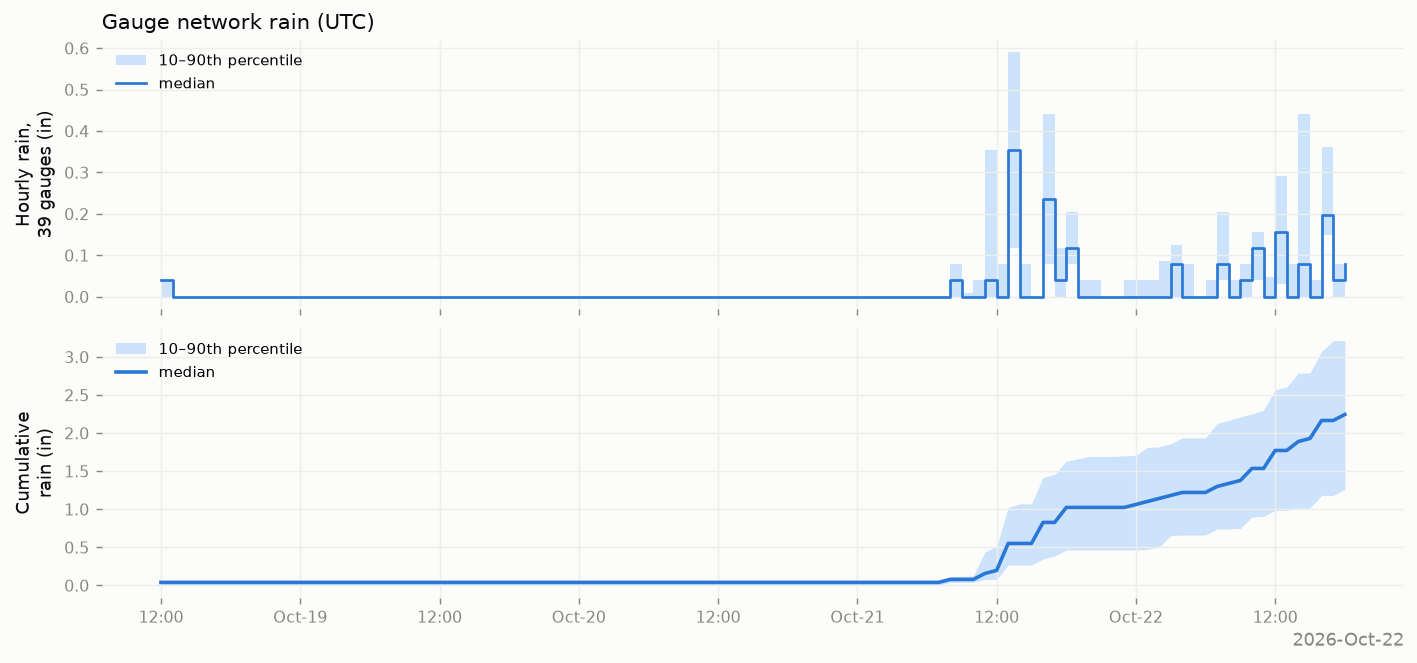
- Network rain (39 gauges): median 2.24 in; 10th–90th percentile 1.26–3.21 in; lowest 1.18 in (Spruce Wash at Route 66), highest 3.62 in (Waterline Rd #1 (Lenox-Wupatki Trails)).
- Peak hour: network median 0.35 in (hour beginning Oct 21 06:00 MST); highest single-gauge hour 0.63 in.
- SNOTEL event precipitation: Fort Valley 0.7 in; Snowslide Canyon 2.8 in; Fry 1.6 in.
- Provisional: ERA5 does not yet cover this event; maps will be added when it does.
Climate context
- Airport precipitation: 0.83 in over 5 local days (1 day not yet reported), against a 1991–2020 normal of 0.24 in for those days (3× normal).
- Rank: the 78th largest 5-day airport total in October among 129 years with data since 1898 (each year’s largest 5-day total ending in October).
- Airport temperature: highs averaged -1.5 °F and lows +9.0 °F relative to normal.
- Water year to date (Oct 1, 2026 – Oct 22, 2026): airport 4.38 in (normal 1.08 in); SNOTEL Fort Valley 5.20 in (median 0.50 in); Snowslide Canyon 10.70 in (median 1.60 in); Fry 7.30 in (median 0.80 in).
Station data
Flagstaff airport (local days; normals 1991–2020; M = not yet reported)
| Precip (in) | Normal (in) | Snow (in) | High (°F) | High vs normal | Low (°F) | Low vs normal | |
|---|---|---|---|---|---|---|---|
| Oct 18 | 0.09 | 0.05 | 0.0 | 56 | -7 | 41 | +10 |
| Oct 19 | 0.00 | 0.05 | M | 62 | +0 | 35 | +5 |
| Oct 20 | 0.00 | 0.05 | 0.0 | 65 | +3 | 33 | +3 |
| Oct 21 | 0.74 | 0.04 | 0.0 | 60 | -2 | 48 | +18 |
| Oct 22 | M | 0.05 | M | M | M | M | M |
| Total | 0.83 | 0.24 | 0.0 |
SNOTEL (water-year precipitation from Oct 1; medians 1991–2020)
| site | Event precip (in) | Water-year precip (in) | Median to date (in) | % of median | SWE at end (in) | Max snow depth (in) |
|---|---|---|---|---|---|---|
| Fort Valley | 0.7 | 5.2 | 0.5 | — | 0 | 0 |
| Snowslide Canyon | 2.8 | 10.7 | 1.6 | — | 0 | 1 |
| Fry | 1.6 | 7.3 | 0.8 | — | 0 | 0 |