September 27–30, 2026
IVT ≥ 250
Tropical cyclone nearby
Snow
Final
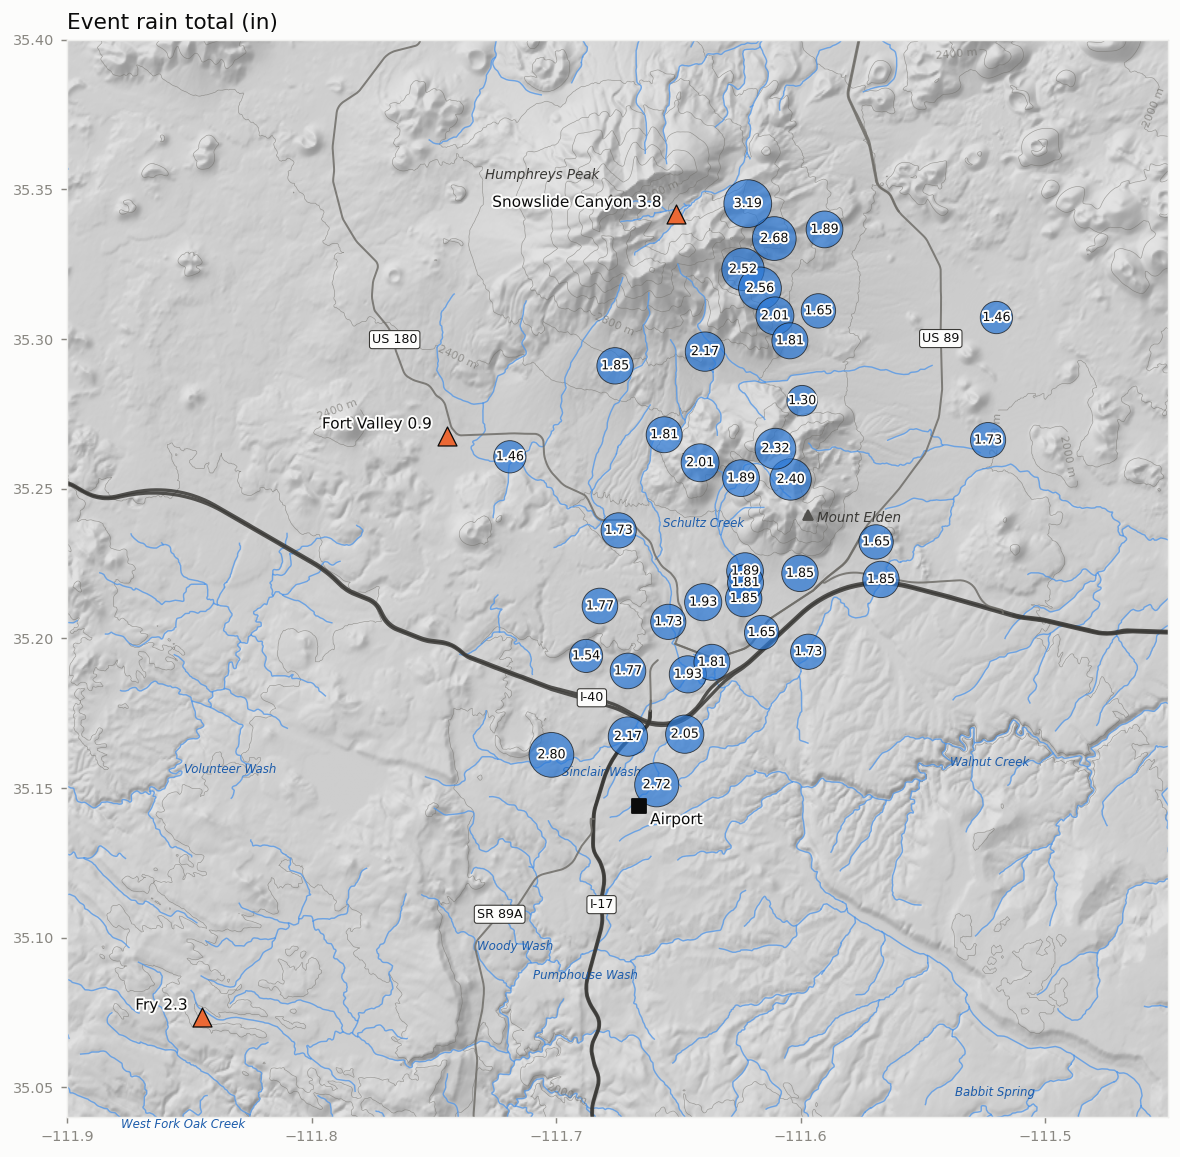
Network median 1.85 in (range 1.30–3.19 in); peak IVT 388 kg m⁻¹ s⁻¹ from the SW; Polo within 1,500 km
Summary
Across 39 gauges the event total ranged from 1.30 to 3.19 in (median 1.85 in). The central 80% of the network-mean rain fell between Sep 28 03:00 MST and Sep 30 03:00 MST (48 h). Moisture transport over Flagstaff reached atmospheric-river strength: ERA5 IVT was at or above 250 kg m⁻¹ s⁻¹ for 30 h and peaked at 388 kg m⁻¹ s⁻¹ from the SW at Sep 28 05:00 MST. 28% of the network-mean rain fell while IVT was at or above 250. Polo came within 649 km of Flagstaff (Sep 29 17:00 MST, remnant disturbance). At the IVT peak, 500-hPa flow over Flagstaff was from the SW at 29 m s⁻¹, and the 500-hPa trough axis along 35.25°N was at 120.8°W, 827 km west of Flagstaff (5,701 m, against 5,813 m over Flagstaff). A closed 500-hPa low (5,660 m) was centred 903 km to the WNW, at 37.8°N 121.2°W. The strongest 250-hPa wind within 1,000 km was 57 m s⁻¹, 650 km to the N. The 250-hPa wind over Flagstaff peaked at 45 m s⁻¹ (Sep 27 23:00 MST), 6 h before the IVT peak.
Rain across the network
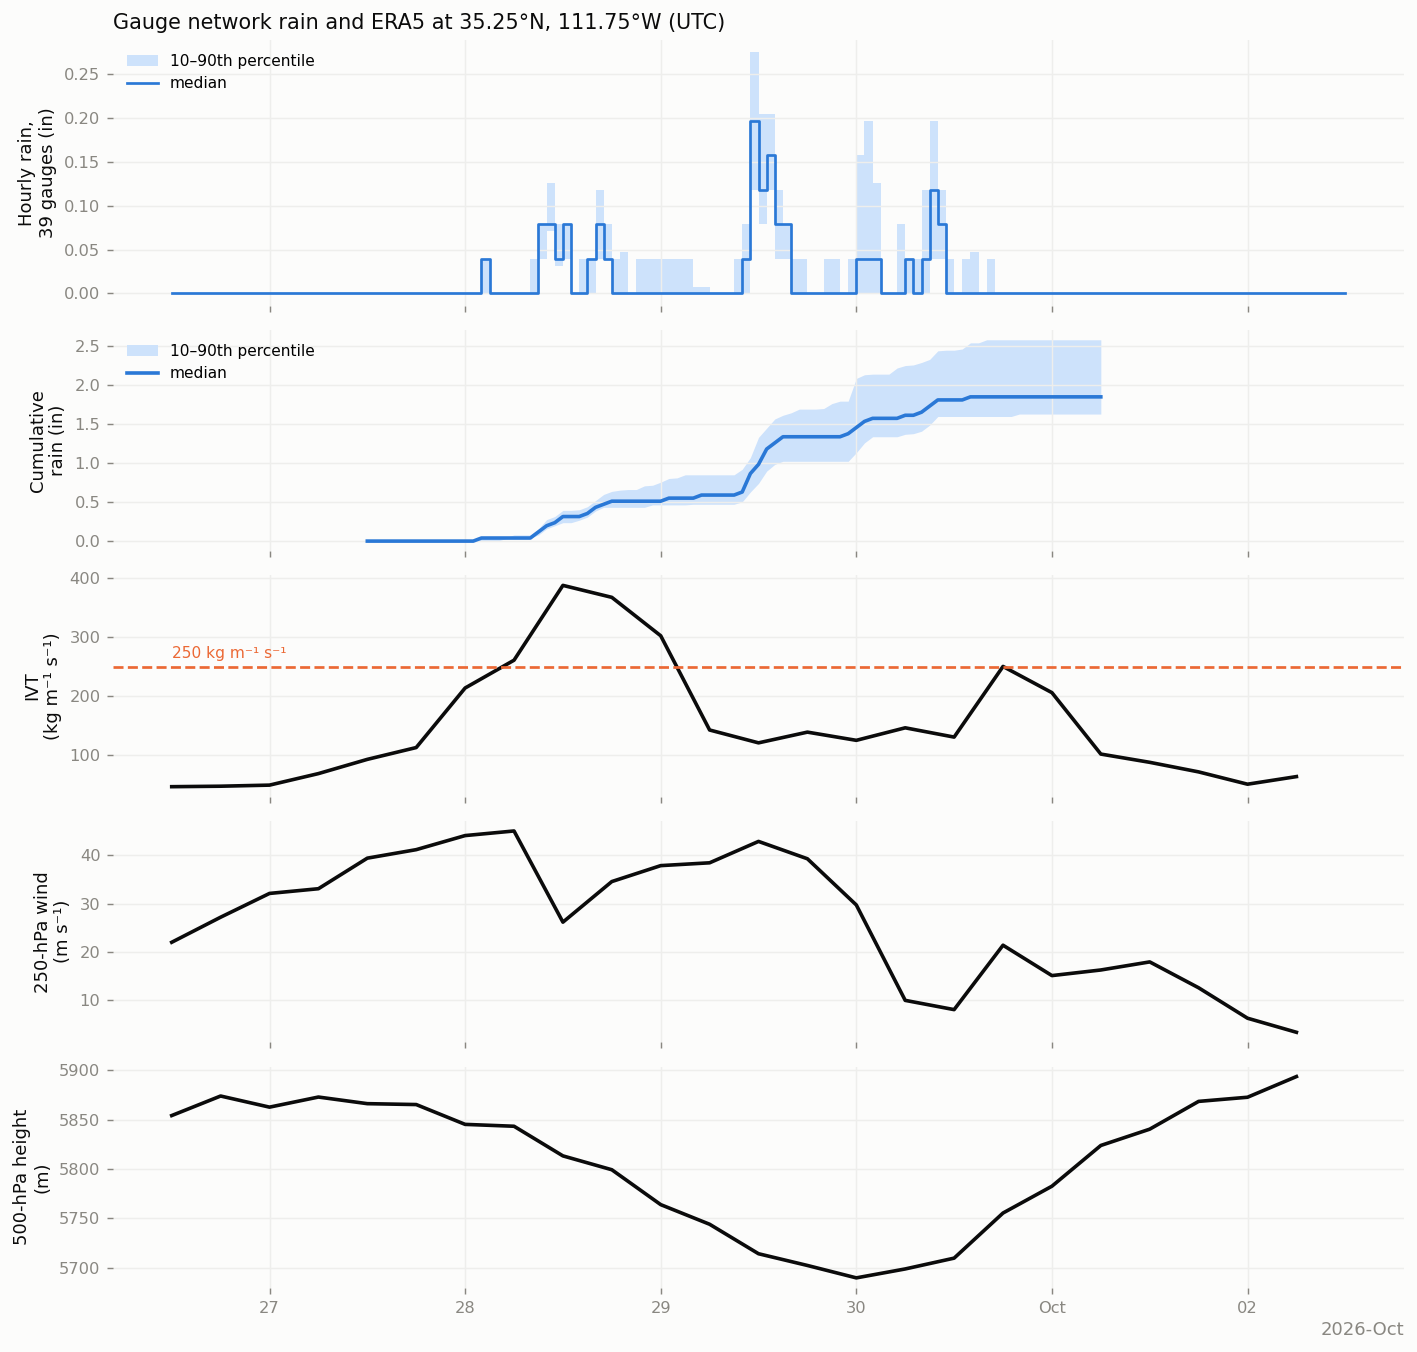
- Network rain (39 gauges): median 1.85 in; 10th–90th percentile 1.63–2.58 in; lowest 1.30 in (Offenhouser), highest 3.19 in (Waterline Rd #1 (Lenox-Wupatki Trails)).
- Peak hour: network median 0.20 in (hour beginning Sep 29 04:00 MST); highest single-gauge hour 0.79 in.
- SNOTEL event precipitation: Fort Valley 0.9 in; Snowslide Canyon 3.8 in; Fry 2.3 in.
- ERA5 at Flagstaff: peak IVT 388 kg m⁻¹ s⁻¹; maximum 250-hPa wind 45 m s⁻¹; minimum 500-hPa height 5,690 m; maximum total column water vapour 23 mm.
- Polo (NHC best track, peak 155 kt): closest approach 649 km at Sep 29 17:00 MST, 30.0°N 108.5°W (remnant disturbance, 30 kt).
Atmospheric setting
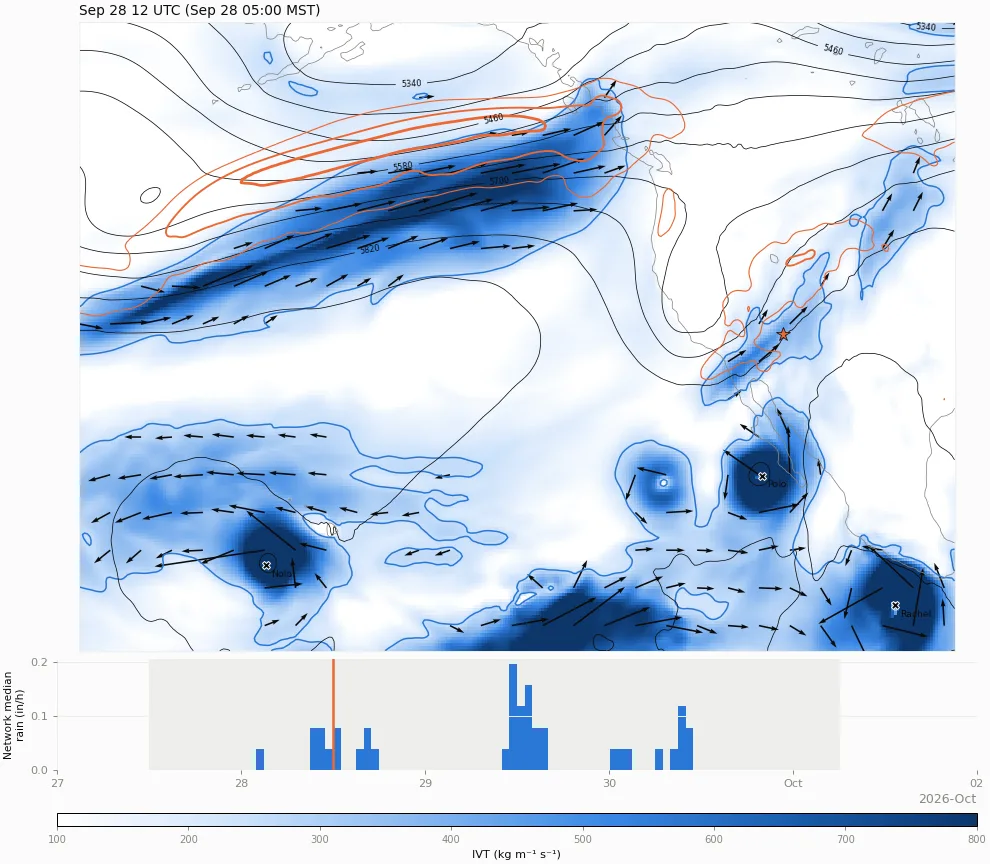
Sep 28 12 UTC · Sep 28 05:00 MST
ERA5 every 6 hours, from 12 h before to 12 h after the event window, opening at the time of peak IVT at Flagstaff. Shading: integrated vapour transport (IVT); blue contour and arrows: IVT ≥ 250 kg m⁻¹ s⁻¹. Black: 500-hPa height (60-m interval). Orange: 250-hPa wind 40, 55 and 70 m s⁻¹. ★ Flagstaff; ✕ NHC best-track position. Lower strip: network median hourly rain, with the event window shaded and the map time marked in orange. Step with the buttons, slider or ← → keys; space plays and pauses.
Climate context
- Airport precipitation: 2.68 in over 4 local days, against a 1991–2020 normal of 0.17 in for those days (16× normal).
- Rank: the 10th largest 4-day airport total in September among 129 years with data since 1898 (each year’s largest 4-day total ending in September).
- Airport temperature: highs averaged -9.2 °F and lows +7.0 °F relative to normal.
- Water year to date (Oct 1, 2025 – Sep 30, 2026): airport 22.4 in (109% of normal); SNOTEL Fort Valley 19.1 in (101% of median); Snowslide Canyon 40.1 in (115% of median); Fry 31.9 in (118% of median).
Station data
Flagstaff airport (local days; normals 1991–2020; M = not yet reported)
| Precip (in) | Normal (in) | Snow (in) | High (°F) | High vs normal | Low (°F) | Low vs normal | |
|---|---|---|---|---|---|---|---|
| Sep 27 | 0.07 | 0.05 | 0 | 72 | +1 | 43 | +5 |
| Sep 28 | 0.62 | 0.04 | 0 | 54 | -16 | 50 | +12 |
| Sep 29 | 1.65 | 0.04 | 0 | 57 | -13 | 44 | +7 |
| Sep 30 | 0.34 | 0.04 | 0 | 61 | -9 | 41 | +4 |
| Total | 2.68 | 0.17 | 0 |
SNOTEL (water-year precipitation from Oct 1; medians 1991–2020)
| site | Event precip (in) | Water-year precip (in) | Median to date (in) | % of median | SWE at end (in) | Max snow depth (in) |
|---|---|---|---|---|---|---|
| Fort Valley | 0.9 | 19.1 | 19 | 101 | 0 | 0 |
| Snowslide Canyon | 3.8 | 40.1 | 35 | 115 | 0.2 | 1 |
| Fry | 2.3 | 31.9 | 27 | 118 | 0 | 0 |