Individual maps
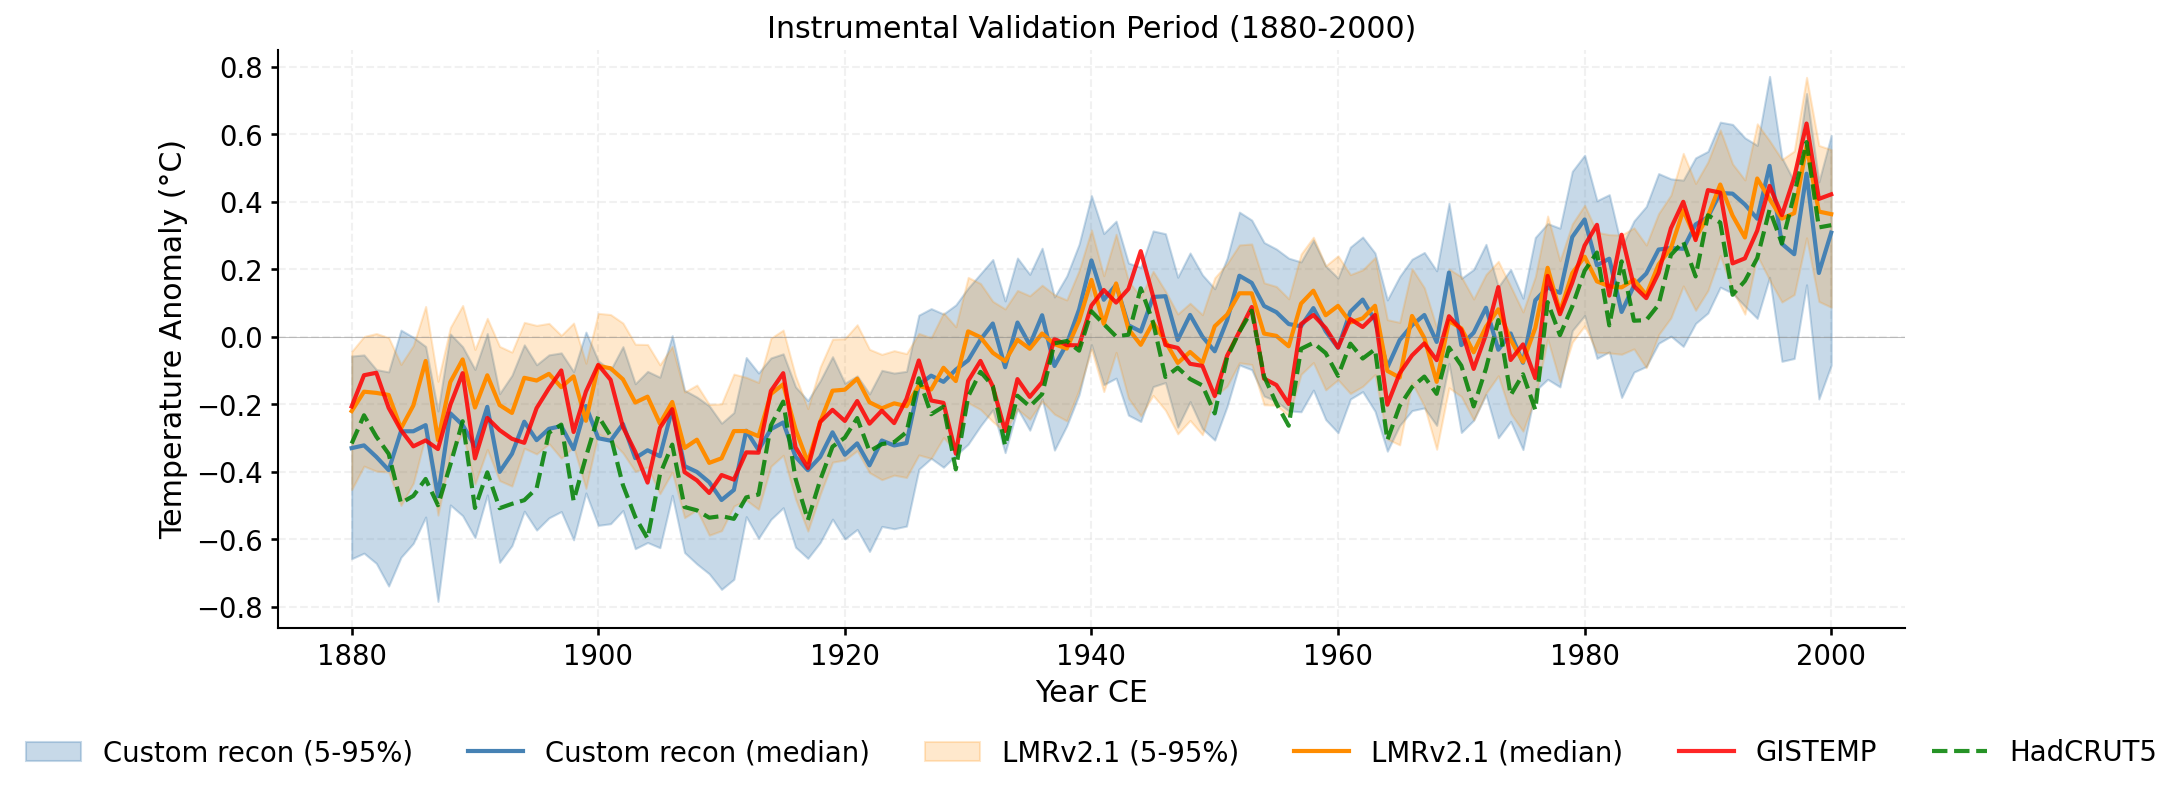
Validation of the custom LMR reconstruction against instrumental observations and the published LMRv2.1, following the methodology of PReSto2k validation.
Performance of the ensemble-median global mean surface temperature (GMST) against instrumental datasets over the validation window. Two metrics are reported for each reconstruction/reference pair.
Pearson correlation (R): linear association between the two time series. R measures pattern agreement but is insensitive to systematic offsets or amplitude errors.
Nash–Sutcliffe Coefficient of Efficiency
(CE; Nash & Sutcliffe, 1970):
CE = 1 − Σ(y −
Ŷ)2 /
Σ(y − Ȳ)2,
where y is the observation, Ŷ is the
reconstruction, and Ȳ is the mean of the observations
over the validation window.
CE captures pattern, amplitude, and bias simultaneously:
Reference datasets: GISTEMP (NASA GISS surface temperature analysis, ERSSTv4 ocean; data.giss.nasa.gov); HadCRUT5 (Met Office Hadley Centre / CRU analysis; metoffice.gov.uk); Consensus — the arithmetic mean of the instrumental datasets listed above, taken over the years where all inputs have data. This is not an authoritative product; it is a local summary used here to smooth between-dataset differences when evaluating the reconstruction.
| Reconstruction | Reference | R | CE |
|---|---|---|---|
| Custom Recon | GISTEMP | 0.8811 | 0.7470 |
| LMRv2.1 | GISTEMP | 0.9319 | 0.8329 |
| Custom Recon | HadCRUT5 | 0.9094 | 0.6782 |
| LMRv2.1 | HadCRUT5 | 0.9329 | 0.5648 |
| Custom Recon | Consensus | 0.9000 | 0.7561 |
| LMRv2.1 | Consensus | 0.9367 | 0.7336 |
| Custom Recon | LMRv2.1 (850-2000) | 0.6860 | 0.0093 |
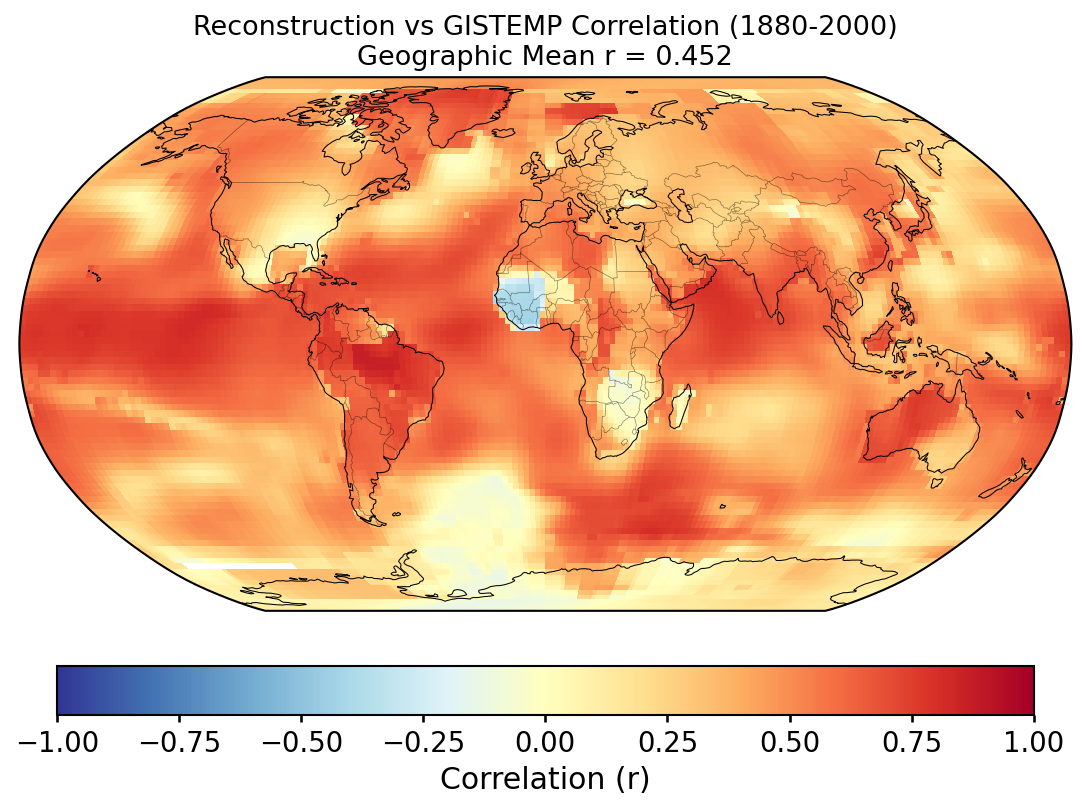
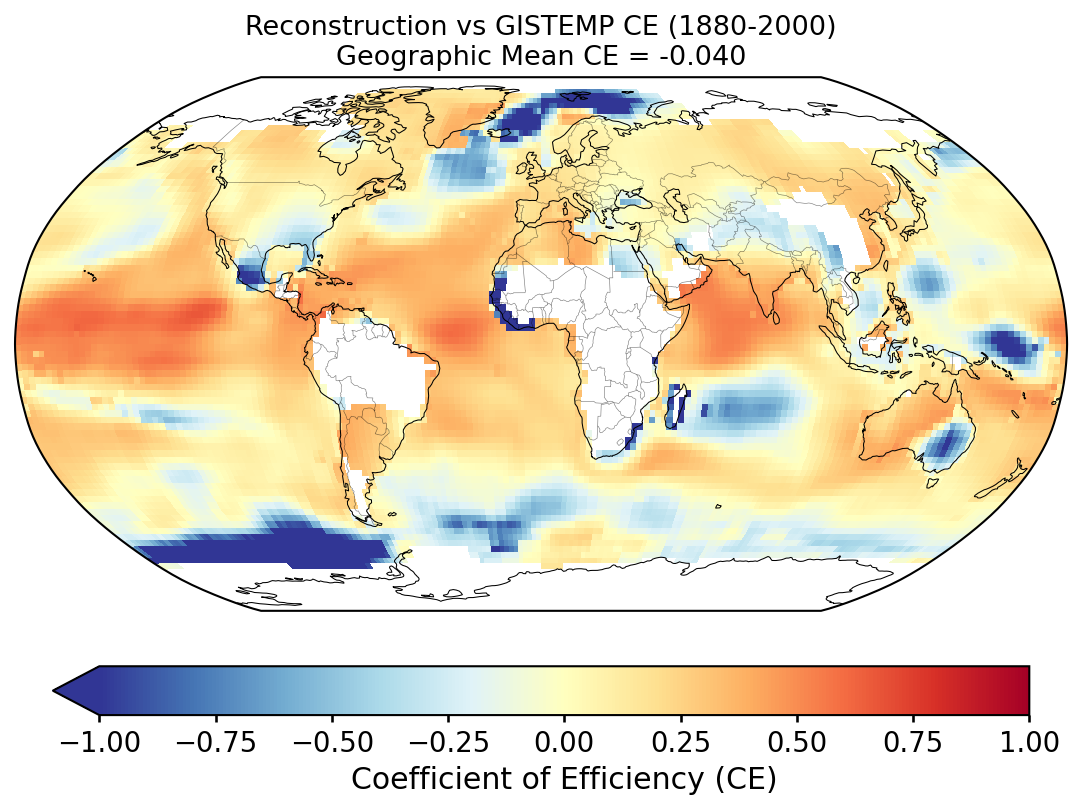
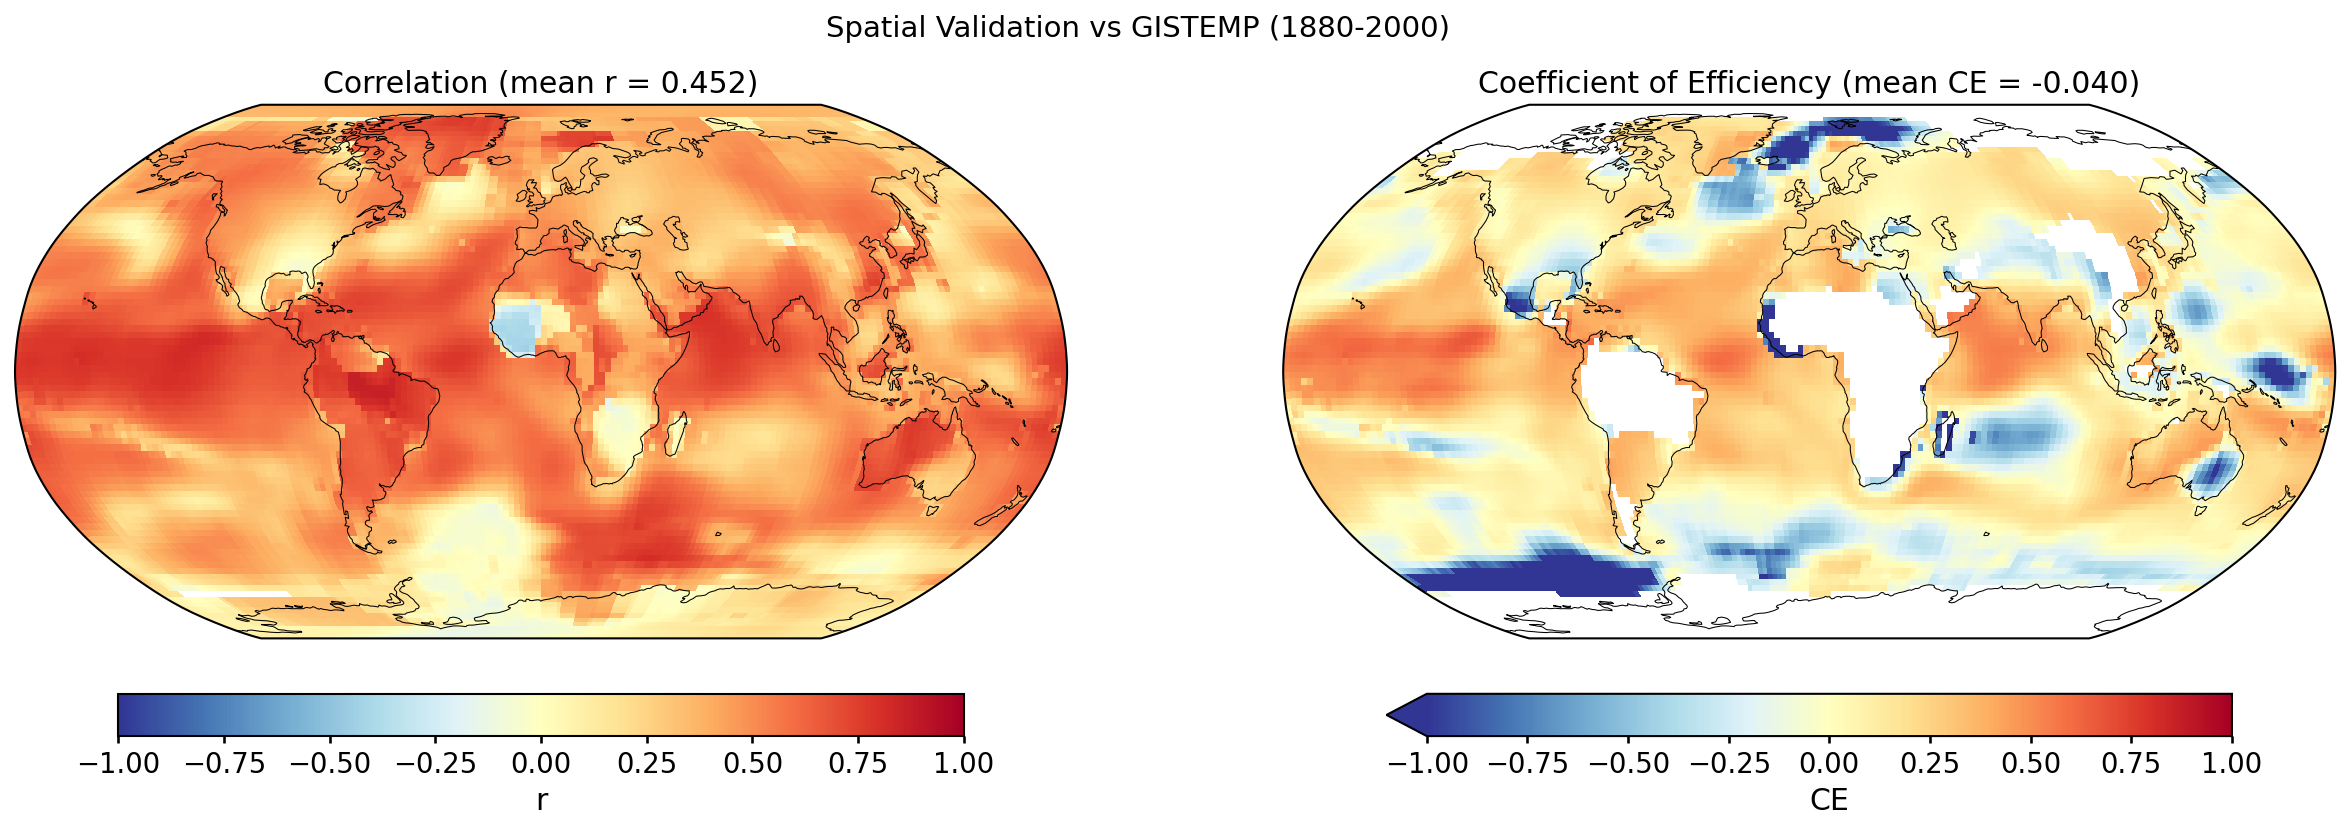
Grid-point R and CE between the custom reconstruction and GISTEMP over 1880–2000. Each cell's score is computed against its own 1951–1980 climatology (for anomalies) and its own time-series mean over the validation window (for the CE denominator); the geographic mean reported with each map is area-weighted.
Why the geographic-mean CE is so much lower than the GMST CE. The two numbers measure different things. At any single grid cell, most of the observed variance is local — weather noise, regional modes (ENSO, NAO, AMO, PDO) — which a paleoclimate reconstruction does not resolve. The reconstruction primarily captures the large-scale, slowly varying forced signal (volcanic, solar, anthropogenic), which is a small fraction of local variance. So per-cell CE is typically low or negative across much of the globe. When those cells are averaged into the global mean, the local noise averages towards zero and the forced signal dominates the residual variance, so the global-mean CE ends up much higher. In other words, the geographic mean of per-cell CE is not the CE of the geographic-mean time series — these are two different statistics and should not be expected to match.
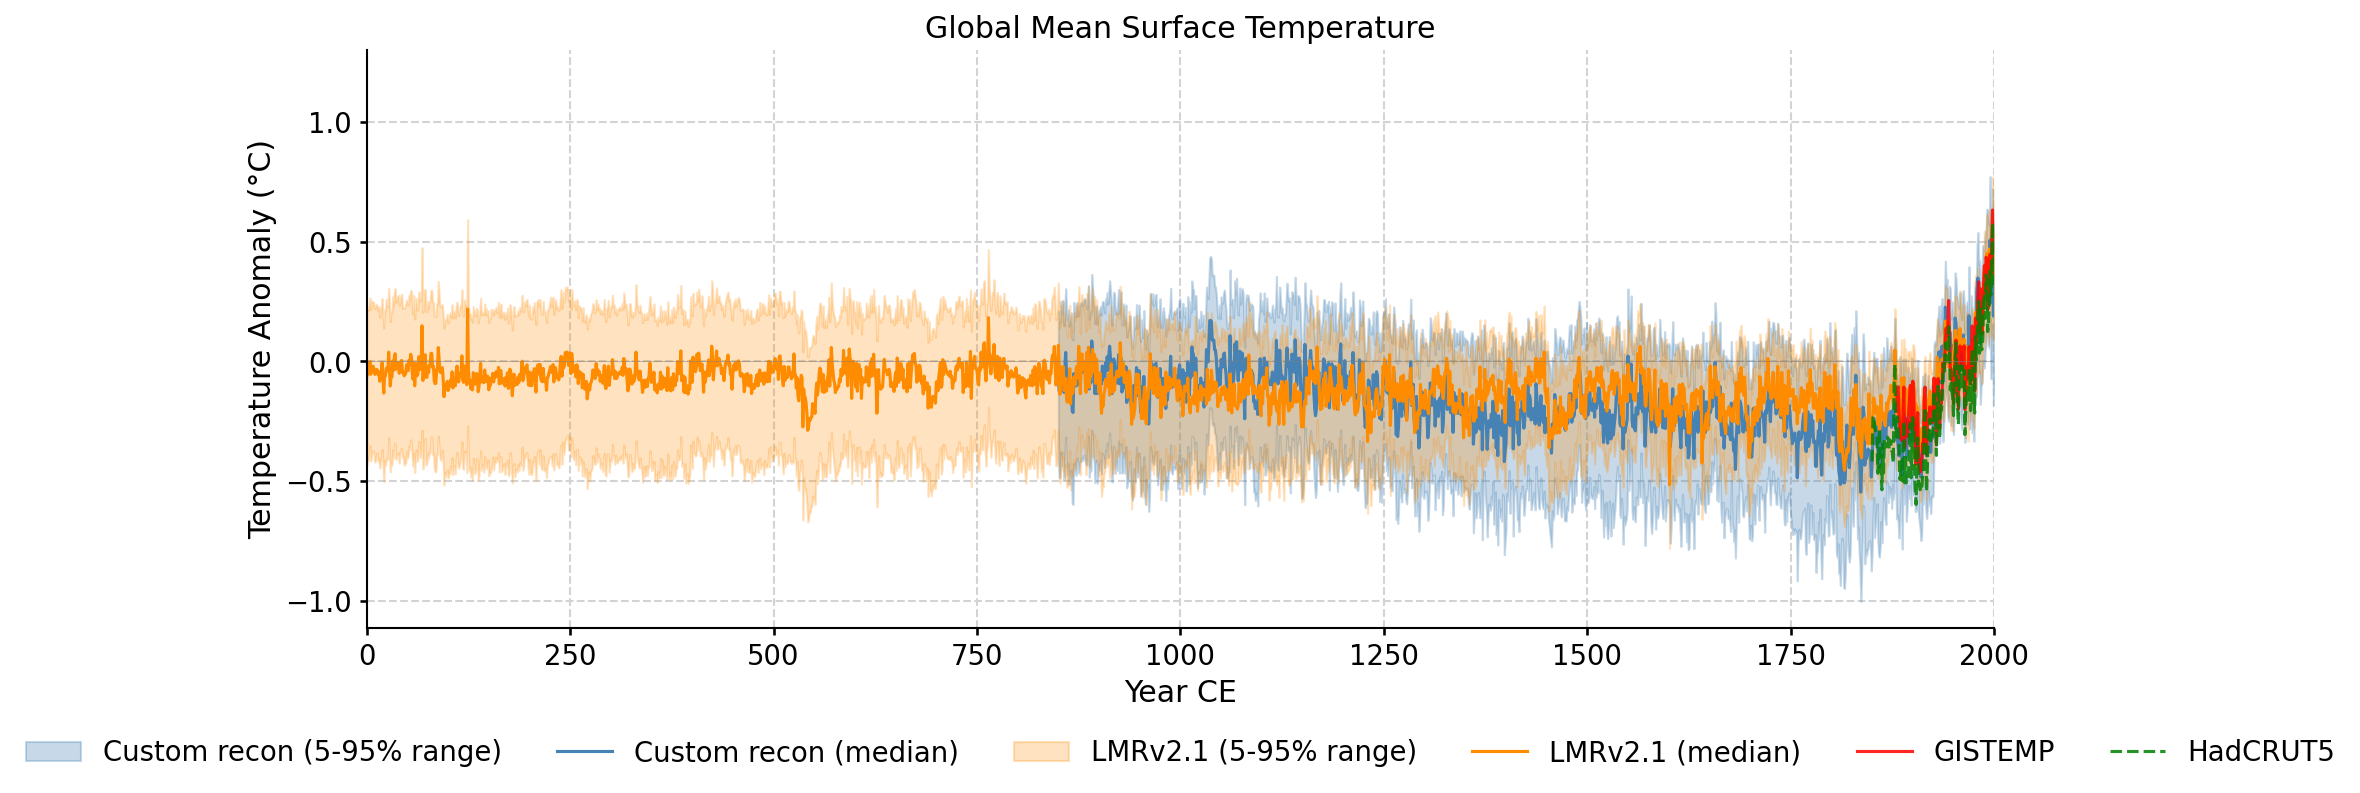
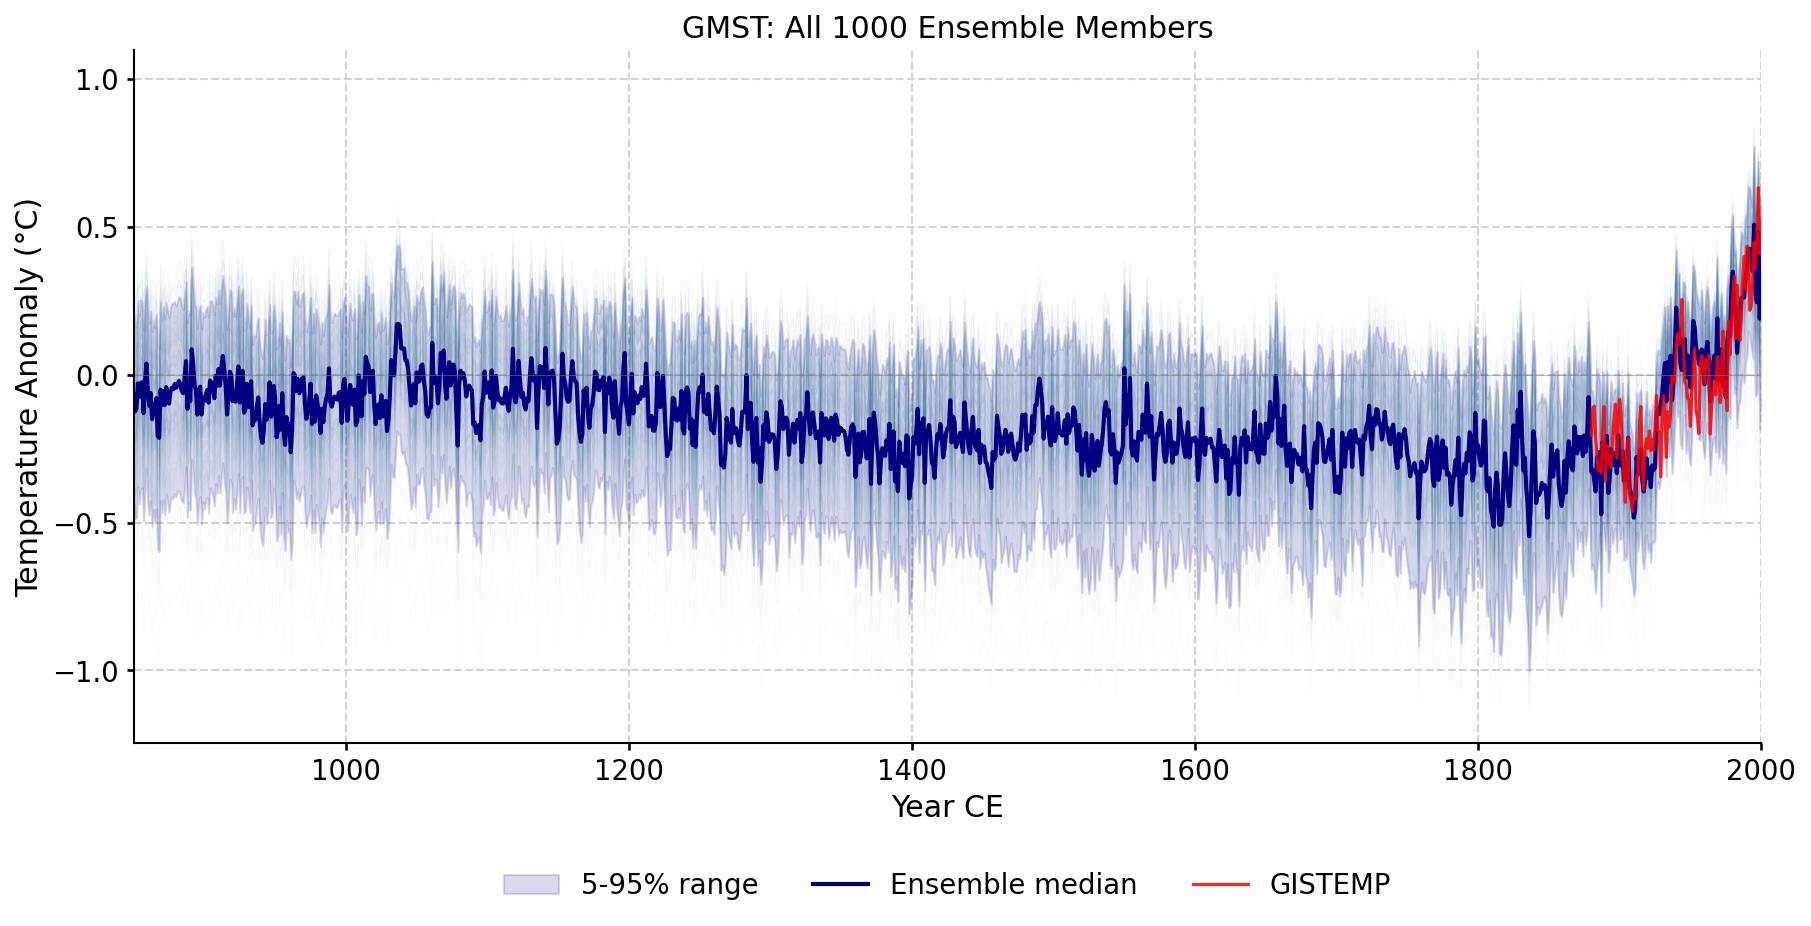
Custom reconstruction ensemble spread compared against LMRv2.1, GISTEMP, and HadCRUT5.
Every ensemble member plotted individually, showing the full spread of the reconstruction across all iterations and seeds.
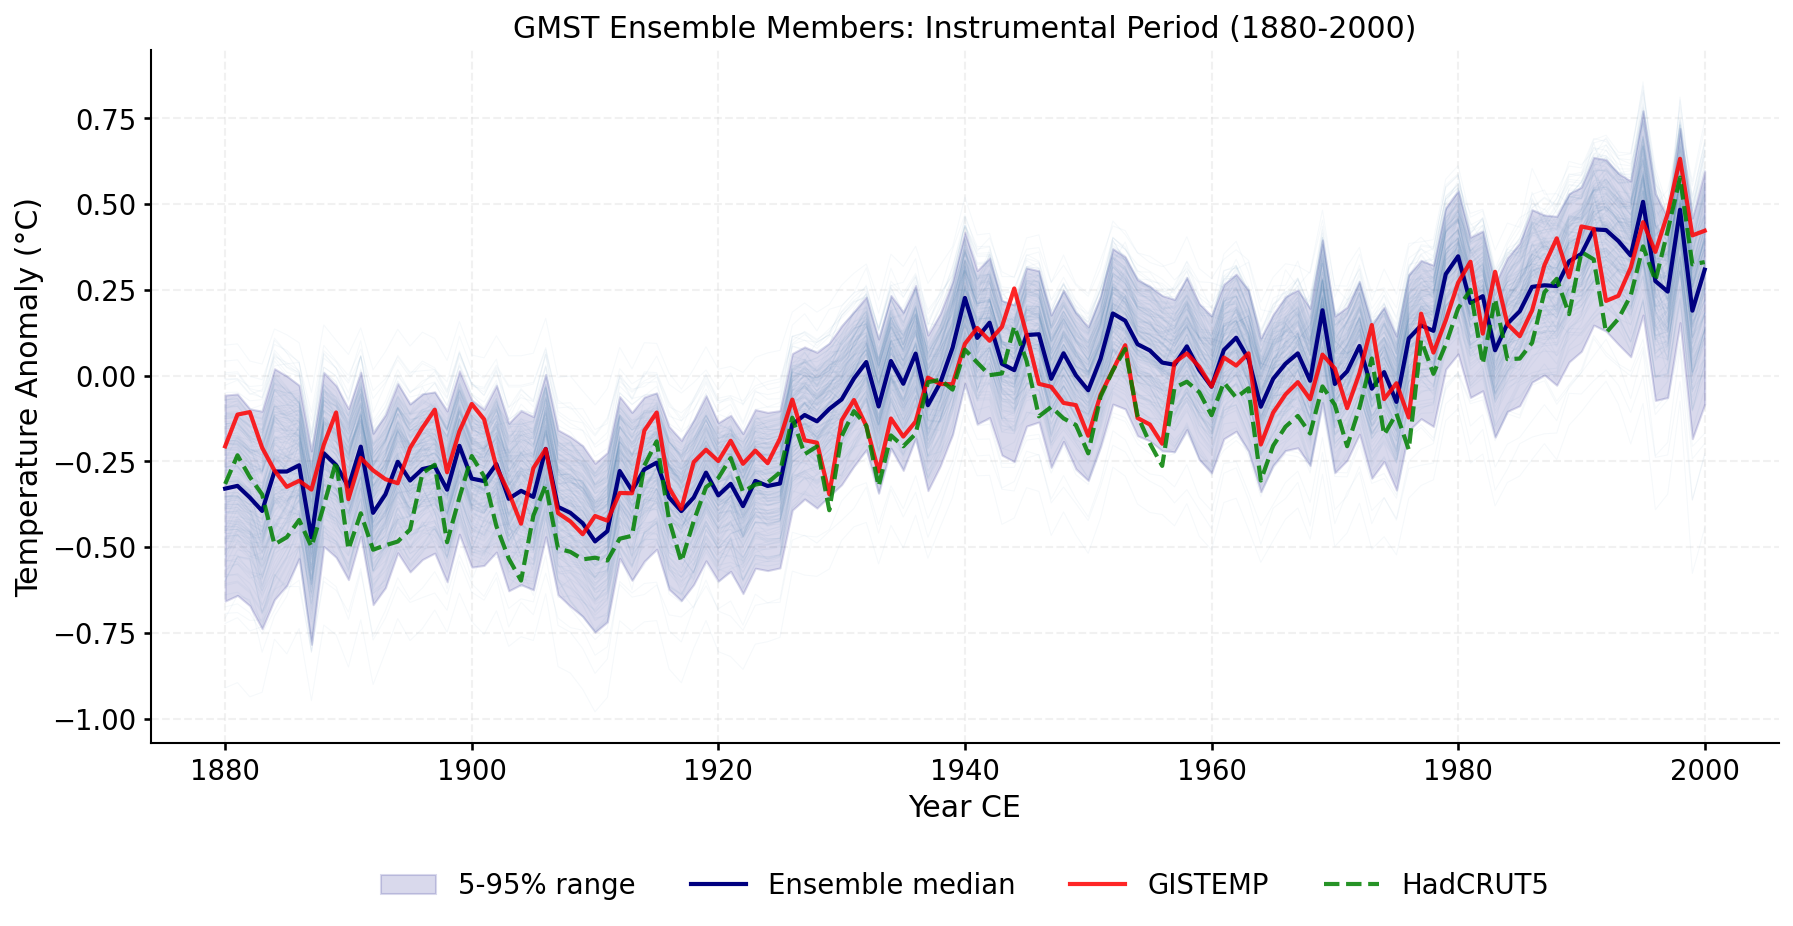
Zoomed view of ensemble members during the instrumental overlap period, with GISTEMP and HadCRUT5 overlaid.
Zoomed view of the validation period (1880-2000) with ensemble spread and all reference datasets.
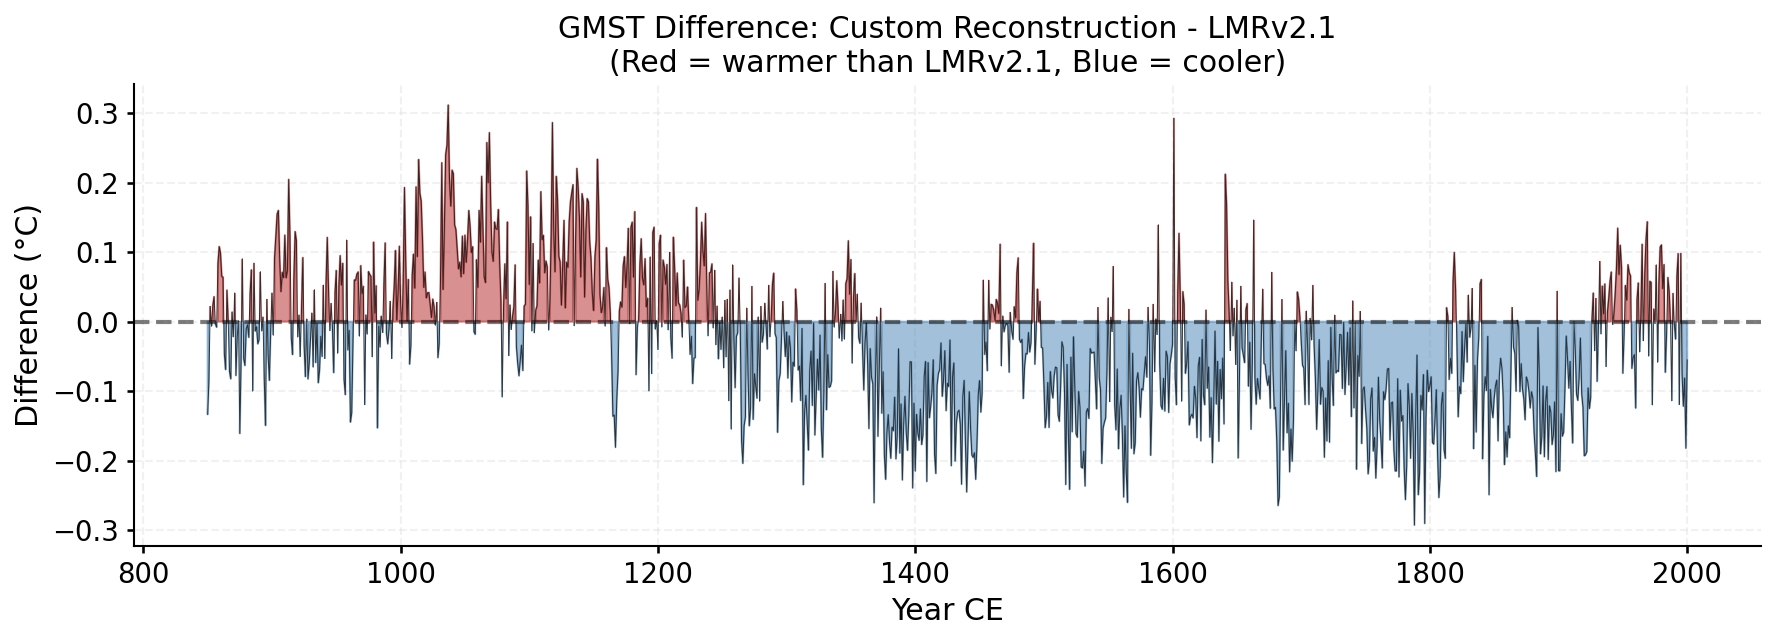
Year-by-year difference between the custom reconstruction and LMRv2.1 ensemble medians. Red = warmer, Blue = cooler.
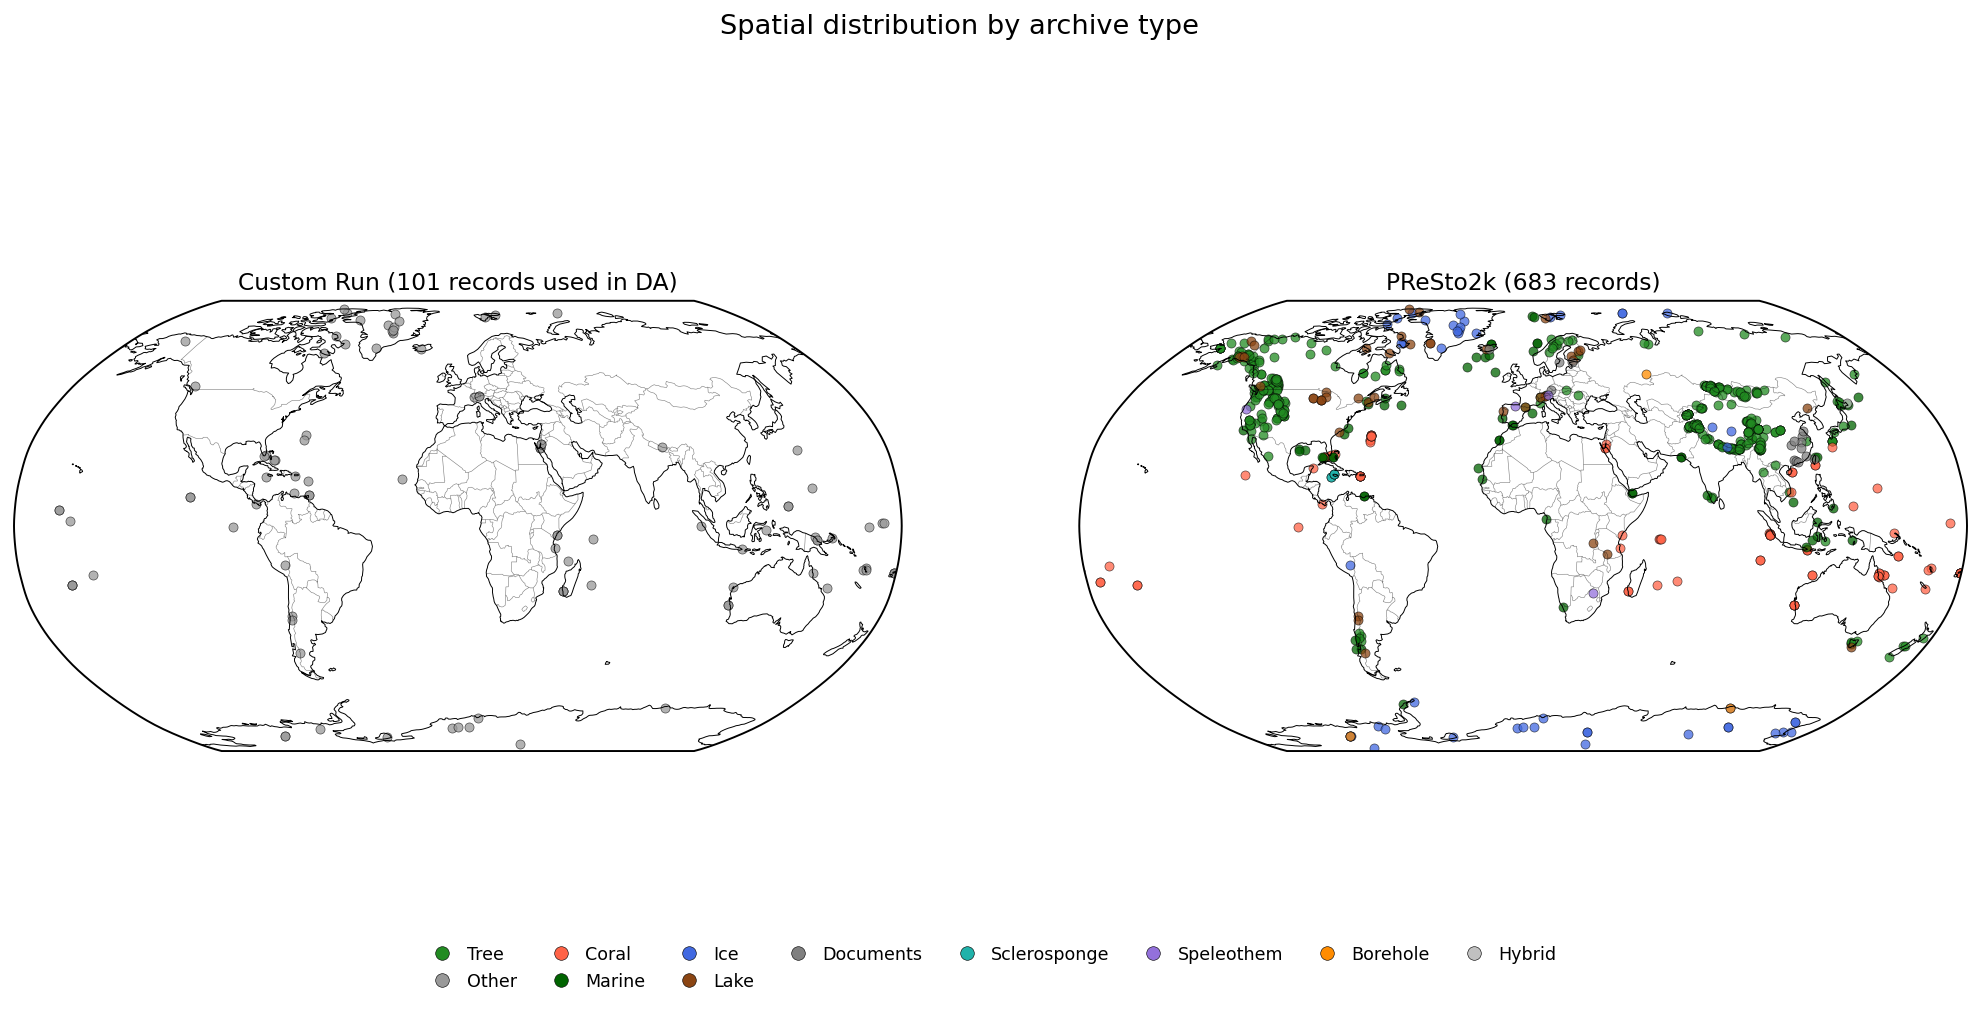
Comparison of the proxy records used in this reconstruction
(those assimilated into the Kalman filter together with those
withheld for evaluation) against the published
PReSto2k reference database, matched on
paleoData_TSid.
Attrition of records from presto's initial TSID request through pipeline filtering, PSM calibration, and final assimilation.
| Statistic | Custom (assimilated + evaluation) | PReSto2k |
|---|---|---|
| Number of records | 101 | 683 |
| Distinct archive types | 1 | 10 |
| Distinct proxy types | 1 | 22 |
| Earliest record start (Year CE) | 850 | 850 |
| Latest record end (Year CE) | 2010 | 2016 |
| Median record length (years) | 235 | 545 |
| Median observations per record | 993 | 488 |
Records counted by compilation, aggregated across all versions (hover the compilation name to see the versions present). A record is counted under every compilation its LiPD metadata claims membership of, so a record listed in both iso2k and CoralHydro2k is counted in both rows.
Source of membership data. Custom-run
memberships come from each record's
paleoData_inCompilationBeta field, extracted in
lipd_to_pdb.py. PReSto2k records do not carry that
field in presto2k_pdb.pkl; their memberships fall
back to lipdverse's single
paleoData_mostRecentCompilations tag (one
compilation per record), so the PReSto2k counts are a lower
bound. Records with no membership land in the (none)
bucket.
A zero count is not a bug. Each compilation
curates its own set of paleoclimate records, often with
different paleoData_TSid namespaces. If presto's
tsids request happens not to intersect a given
compilation's records (e.g. the user requests iso2k corals,
which are physically distinct samples from CoralHydro2k's
corals), that compilation will show 0 even though the request
listed it under compilation in
query_params.json.
Compilations requested in query_params.json: Pages2kTemperature
| Compilation | Custom | CSV | PReSto2k | CSV | Shared | Custom-only | PReSto2k-only |
|---|---|---|---|---|---|---|---|
| (none) | 101 | ⬇ CSV | 0 | — | 0 | 101 | 0 |
| CoralHydro2k | 0 | — | 44 | ⬇ CSV | 0 | 0 | 44 |
| Pages2kTemperature | 0 | — | 636 | ⬇ CSV | 0 | 0 | 636 |
| iso2k | 0 | — | 3 | ⬇ CSV | 0 | 0 | 3 |
| Archive | Shared | PReSto2k only | Custom only | Total |
|---|---|---|---|---|
| Borehole | 0 | 3 | 0 | 3 |
| Coral | 0 | 92 | 0 | 92 |
| Documents | 0 | 15 | 0 | 15 |
| Hybrid | 0 | 1 | 0 | 1 |
| Ice | 0 | 49 | 0 | 49 |
| Lake | 0 | 43 | 0 | 43 |
| Marine | 0 | 57 | 0 | 57 |
| Other | 0 | 0 | 101 | 101 |
| Sclerosponge | 0 | 5 | 0 | 5 |
| Speleothem | 0 | 4 | 0 | 4 |
| Tree | 0 | 414 | 0 | 414 |
| Total | 0 | 683 | 101 | 784 |
| ptype | Shared | PReSto2k only | Custom only |
|---|---|---|---|
| 0 | 0 | 101 | |
| borehole | 0 | 3 | 0 |
| coral.SrCa | 0 | 13 | 0 |
| coral.calc | 0 | 2 | 0 |
| coral.d18O | 0 | 77 | 0 |
| documents | 0 | 15 | 0 |
| hybrid | 0 | 1 | 0 |
| ice.d18O | 0 | 39 | 0 |
| ice.dD | 0 | 8 | 0 |
| ice.melt | 0 | 2 | 0 |
| lake.BSi | 0 | 2 | 0 |
| lake.accumulation | 0 | 1 | 0 |
| lake.chironomid | 0 | 8 | 0 |
| lake.other | 0 | 19 | 0 |
| lake.reflectance | 0 | 4 | 0 |
| lake.varve_thickness | 0 | 9 | 0 |
| marine.MgCa | 0 | 23 | 0 |
| marine.alkenone | 0 | 21 | 0 |
| marine.other | 0 | 13 | 0 |
| sclerosponge.d18O | 0 | 5 | 0 |
| speleothem.d18O | 0 | 4 | 0 |
| tree.MXD | 0 | 60 | 0 |
| tree.TRW | 0 | 354 | 0 |
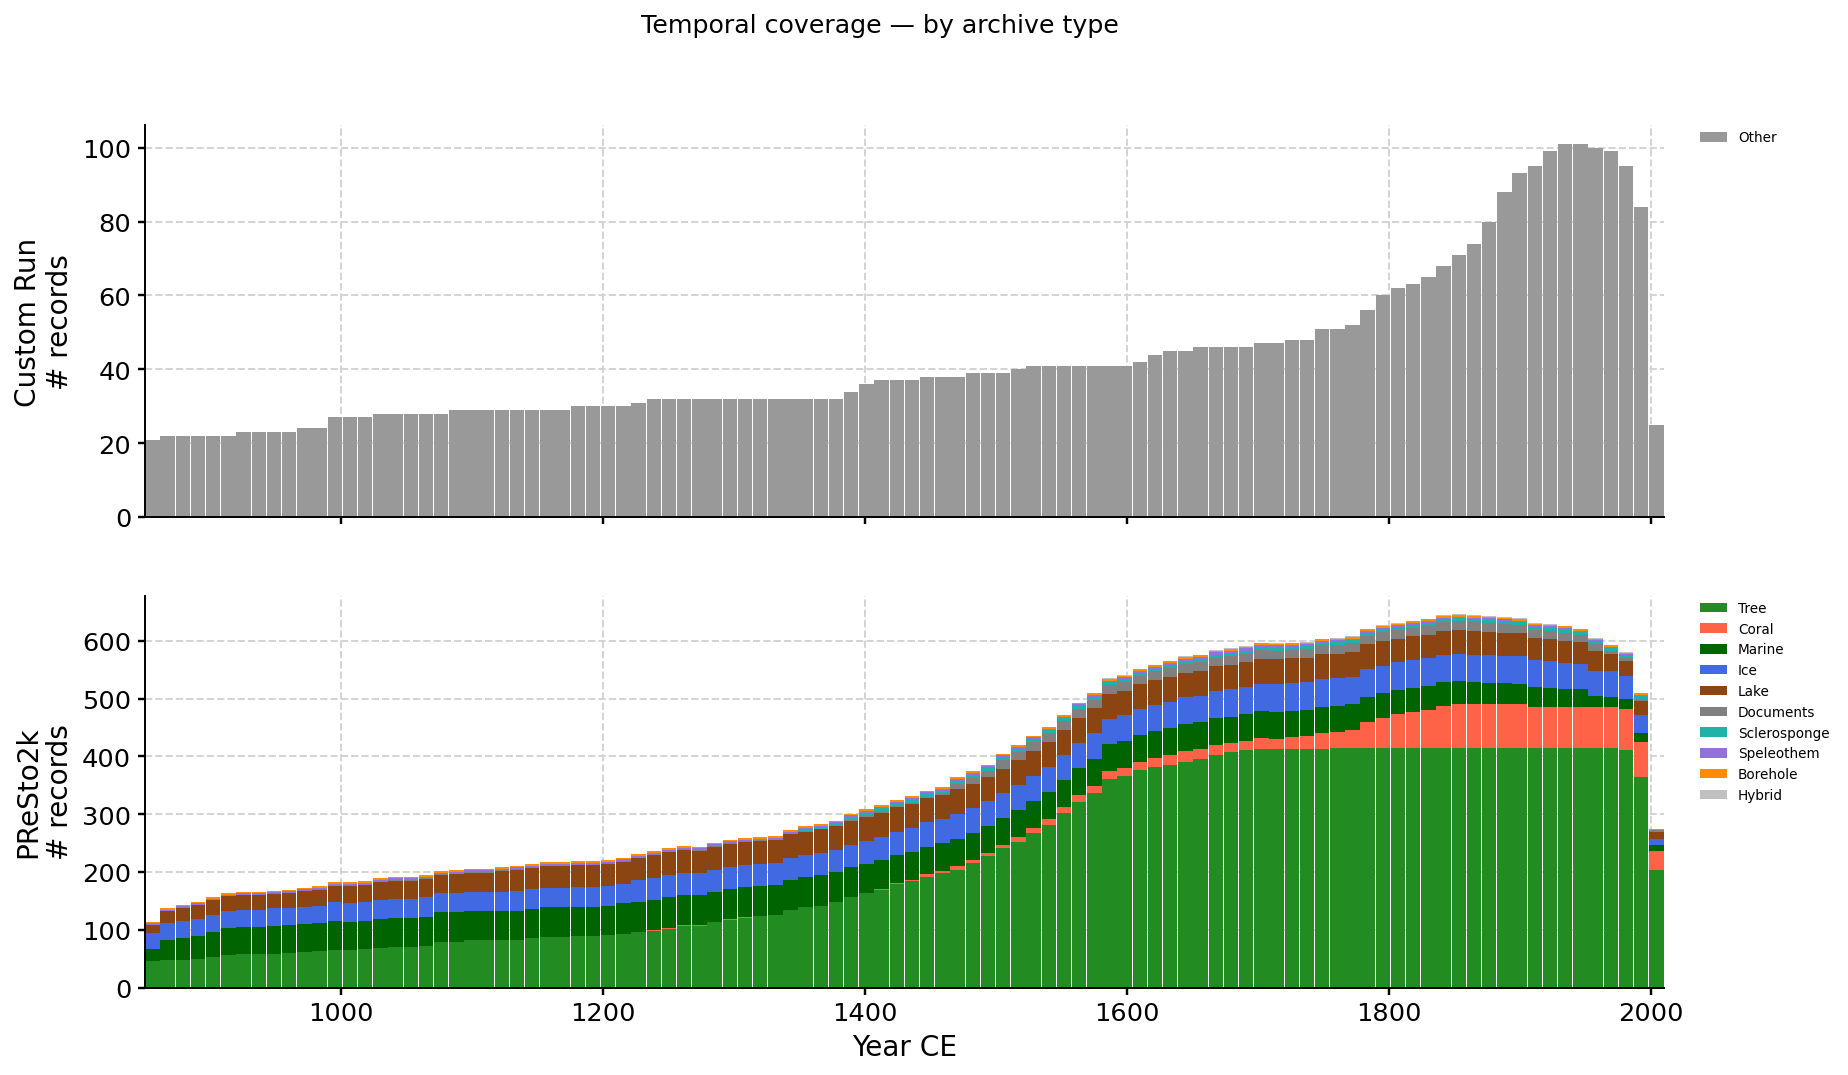
Record counts by year, partitioned by source (custom run on top,
PReSto2k below). Switch between archive-type and proxy-type
(ptype) colouring.
Records present in the PReSto2k reference but absent from the
custom reconstruction (for example, archives excluded by
filter_proxydb_kwargs, or TSIDs not included in the
custom query).
| TSID | Archive | ptype | Dataset | Years | n_obs |
|---|---|---|---|---|---|
AB20MEN02_d18O | Coral | coral.d18O | AB20MEN02 | 1770–1820 | 592 |
AB20MEN03_d18O | Coral | coral.d18O | AB20MEN03 | 1678–1699 | 236 |
AB20MEN04_d18O | Coral | coral.d18O | AB20MEN04 | 1641–1684 | 497 |
AB20MEN05_d18O | Coral | coral.d18O | AB20MEN05 | 1532–1601 | 832 |
AB20MEN06_d18O | Coral | coral.d18O | AB20MEN06 | 1452–1547 | 1072 |
AB20MEN07_d18O | Coral | coral.d18O | AB20MEN07 | 1267–1305 | 466 |
AB20MEN08_d18O | Coral | coral.d18O | AB20MEN08 | 1256–1270 | 164 |
AB20MEN09_d18O | Coral | coral.d18O | AB20MEN09 | 1240–1262 | 260 |
Africa_001 | Speleothem | speleothem.d18O | Afr-ColdAirCave.Sundqvist.2013 | 1635–1992 | 339 |
Africa_004 | Lake | lake.other | Afr-LakeTanganyika.Tierney.2010 | 851–1986 | 60 |
Ant_005 | Ice | ice.d18O | Ant-BerknerIsland.Mulvaney.2002 | 1000–1992 | 991 |
Ant_006 | Ice | ice.d18O | Ant-SiteDML07.Graf.2002 | 1000–1994 | 986 |
Ant_007 | Ice | ice.d18O | Ant-SiteDML05.Graf.2002 | 850–1996 | 1147 |
Ant_008 | Ice | ice.d18O | Ant-SiteDML17.Graf.2002 | 1000–1997 | 984 |
Ant_009 | Ice | ice.d18O | Ant-DomeF1993.Uemura.2014 | 854–1467 | 143 |
Ant_010 | Ice | ice.d18O | Ant-DomeF2001.Uemura.2008 | 853–1875 | 105 |
Ant_011 | Ice | ice.d18O | Ant-DSS.Moy.2012 | 850–1995 | 1146 |
Ant_012 | Ice | ice.d18O | Ant-DomeC.Stenni.2001 | 854–1918 | 86 |
Ant_013 | Ice | ice.dD | Ant-DomeC.Jouzel.2001 | 854–1918 | 86 |
Ant_014 | Ice | ice.dD | Ant-Ferrigno.Thomas.2013 | 1703–2010 | 308 |
Ant_017 | Ice | ice.d18O | Ant-CoastalDML.Thamban.2012 | 1533–1994 | 462 |
Ant_022 | Ice | ice.dD | Ant-JamesRossIsland.Mulvaney.2013 | 850–2007 | 1158 |
Ant_023 | Ice | ice.d18O | Ant-PlateauRemote.Mosley-Thompson.2013 | 850–1986 | 1137 |
Ant_024 | Ice | ice.d18O | Ant-SipleStation.Mosley-Thompson.1990 | 1417–1983 | 567 |
Ant_025 | Ice | ice.d18O | Ant-TALDICE.Stenni.2010 | 856–1990 | 117 |
⬇ Download full CSV (683 rows)
Records requested in this reconstruction that do not appear in the PReSto2k reference.
| TSID | Archive | ptype | Dataset | Years | n_obs |
|---|---|---|---|---|---|
Ant-BerknerIsland.Mulvaney.2002 | Other | 1000–1992 | 993 | ||
Ant-CoastalDML.Thamban.2012 | Other | 1533–1994 | 462 | ||
Ant-DSS.Moy.2012 | Other | 850–1995 | 1146 | ||
Ant-PlateauRemote.Mosley-Thompson.2013 | Other | 850–1986 | 1137 | ||
Ant-SipleStation.Mosley-Thompson.1990 | Other | 1417–1983 | 567 | ||
Ant-SiteDML05.Graf.2002 | Other | 850–1996 | 1147 | ||
Ant-SiteDML07.Graf.2002 | Other | 1000–1994 | 995 | ||
Ant-SiteDML17.Graf.2002 | Other | 1000–1997 | 998 | ||
Ant-WDC05A.Steig.2013 | Other | 850–2005 | 1156 | ||
Ant-WDC06A.Steig.2013 | Other | 850–2005 | 23120 | ||
Arc-Agassiz.Vinther.2008 | Other | 850–1972 | 1123 | ||
Arc-Austfonna.Isaksson.2005 | Other | 1400–1998 | 554 | ||
Arc-BigRoundLake.Thomas.2009 | Other | 971–2003 | 1033 | ||
Arc-BlueLake.Bird.2008 | Other | 850–2000 | 1151 | ||
Arc-CampCentury.Fisher.1969 | Other | 1242–1967 | 726 | ||
Arc-Crete.Vinther.2010 | Other | 850–1973 | 1124 | ||
Arc-Dye.Vinther.2010 | Other | 850–1978 | 1129 | ||
Arc-GISP2.Grootes.1997 | Other | 850–1987 | 1138 | ||
Arc-GRIP.Vinther.2010 | Other | 850–1979 | 1130 | ||
Arc-Hvitarvatn.Larsen.2011 | Other | 850–2000 | 1151 | ||
Arc-LakeC2.Lamoureux.1996 | Other | 850–1987 | 1138 | ||
Arc-LakeDonardBaffinIsland.Moore.2001 | Other | 850–1992 | 1143 | ||
Arc-Lomonosovfonna.Divine.2011 | Other | 850–1997 | 1148 | ||
Arc-NGRIP1.Vinther.2006 | Other | 850–1995 | 1146 | ||
Arc-NGTB16.Schwager.1998 | Other | 1478–1992 | 515 |
⬇ Download full CSV (101 rows)
| Reason | Records |
|---|---|
| filtered after pickle (ptype filter or PSM calibration) | 139 |